M2E Analytics is a tool designed to help online sellers monitor and evaluate their performance on Amazon, eBay, Walmart, TikTok Shop, Temu, and now, by popular demand, Kaufland, OTTO, Shein, OnBuy, and Mirakl. It offers accurate, easy-to-read metrics that reflect what’s really happening in your account: the number of orders, sales volume, emerging trends, and more.
Unlike external analytics platforms, M2E Analytics shows your internal slice of data – only what’s happening with your own listings. That’s exactly what you need to make informed marketing, inventory, and pricing decisions.
Who benefits from M2E Analytics #
M2E Analytics is free for all M2E Cloud users. The tool will be helpful for a wide range of e-commerce professionals:
| Audience | Core need | How M2E Analytics helps |
| Marketers | Track product performance, plan campaigns | Visualize top sellers and underperformers, plan promos based on real sales trends |
| Sales managers / owners | Make faster business decisions, grow revenue | Monitor revenue across all Channels in one place, identify trends early |
| E-commerce analysts | Access exportable, structured data | Get detailed reports by product, category, time period, and marketplace |
| Multichannel retailers | Manage inventory and demand across platforms | Compare sales velocity on Channels, forecast demand, and plan stock levels accordingly |
| Single-marketplace sellers | Optimize sales for one platform | Get focused insights on the Channel to refine offers and adjust pricing |
| Agencies | Provide reporting transparency to clients | Generate professional reports quickly, even for multiple client accounts |
💡 Want to see how it works in action? Check out our video walkthrough of M2E Analytics.
Key Features #
Channel-based sales overview #
Under the Sales Overview tab, you can monitor sales data across your connected marketplaces with ease. Switch between the channel accounts, or see a consolidated view. Filter by date range, country, or Channel, and view real-time summaries and trend charts.
You can also:
- Track total revenue and order volume
- Compare marketplace performance
- Spot growth opportunities per region or Channel

ℹ️ For Amazon and Temu, you can check Total Fees and Total Promotions to understand your costs and marketing impact.
On this page, you'll also find Brand & Category Analytics for Amazon, eBay, and TikTok Shop. Hover over the eye icon to open a pop-up with breakdowns by brand and category:

Profitability tracking and financial overview #
It’s not just about revenue – profit matters as well. The Profit Analytics tab provides a clear view of your profitability across Channels, which will help you make smarter business decisions.
- View net profit, gross profit, and gross margin by product
- Analyze profitability by Channel
- Optimize pricing and operational costs accordingly

ℹ️ To improve the accuracy of your profit calculations, you can import product cost data into M2E Analytics. If you store costs elsewhere (e.g., in Shopify or Excel), upload a file using the Import Cost button in the Profit Analytics tab. Check out our guide for step-by-step instructions.
If you're using Magento (Adobe Commerce), you can also connect your store via the M2E Analytics Connector to sync product costs automatically and unlock full profit tracking features.
If you're selling on Amazon, use M2E Analytics to track sales through the Amazon marketplace with real figures pulled directly from your account. You’ll see payout history and transaction details in the Payout Overview tab.
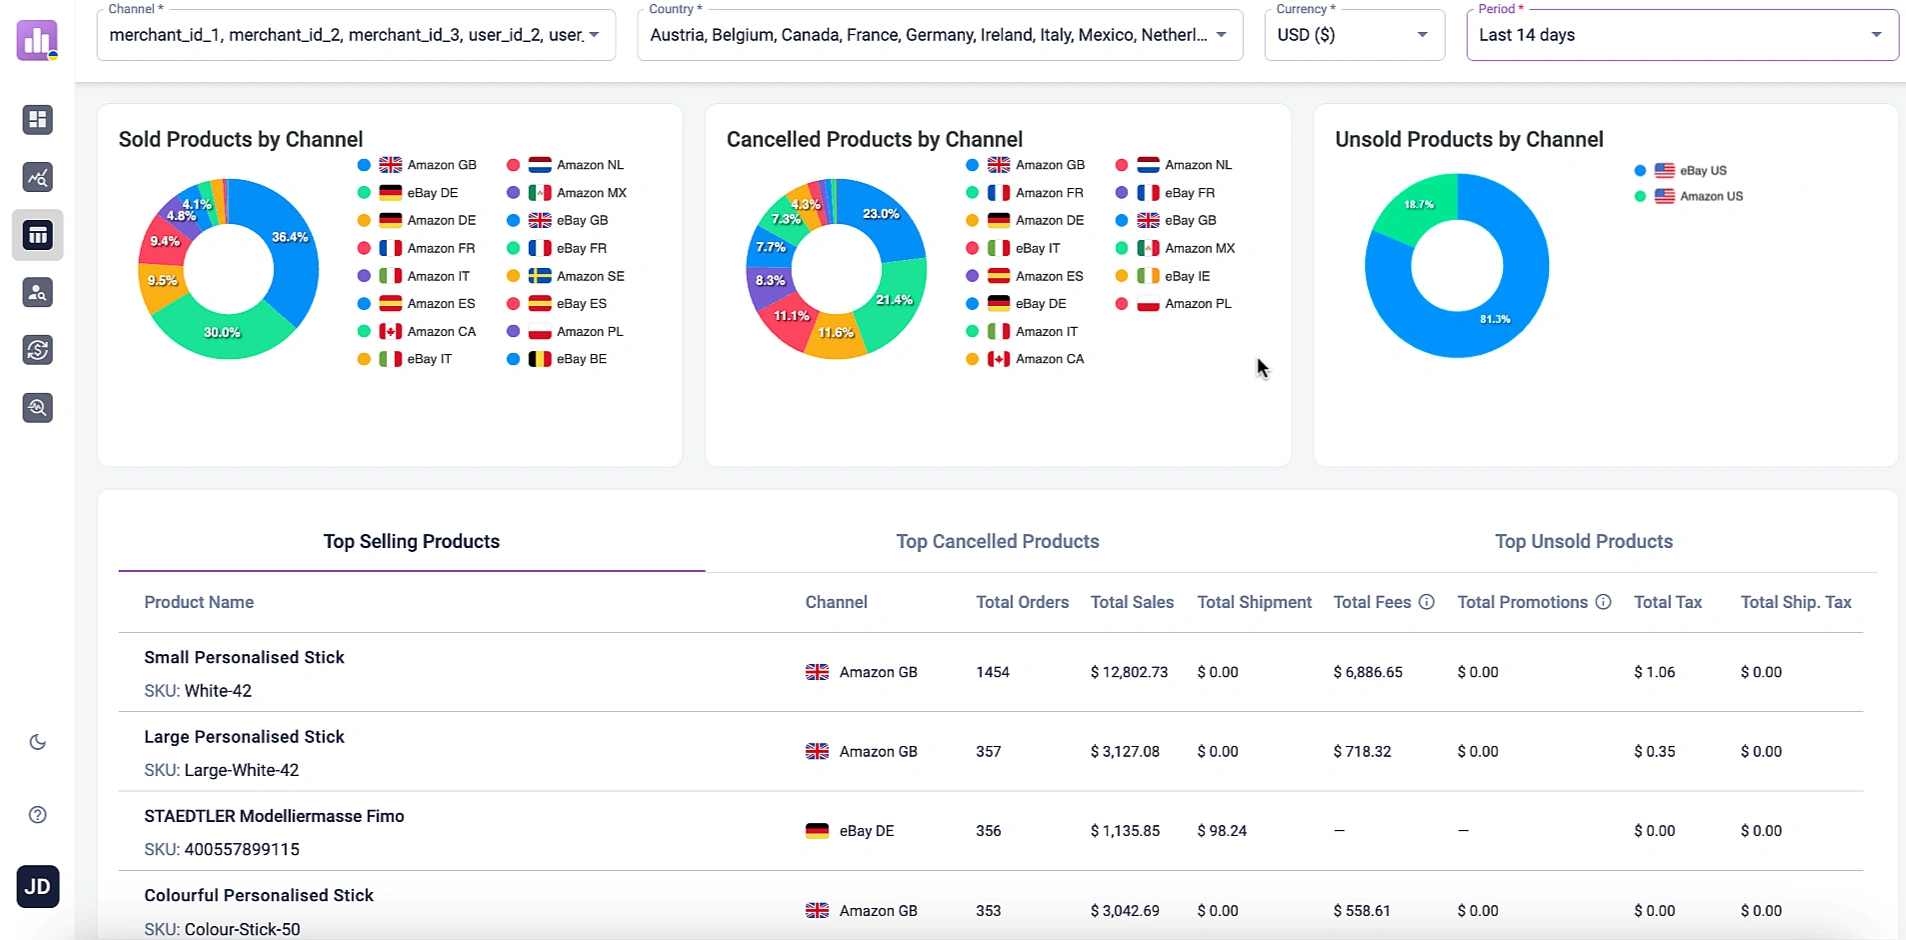
Product performance breakdown #
With the Product Analytics tab, you can quickly identify:
- Best-selling products
- Listings with high refund rates
- Items that remain unsold or generate low engagement
Use this data to adjust stock, fine-tune pricing, or update listing details where necessary. Refund insights also help improve customer satisfaction and reduce return-related costs.
Customer behavior insights #
Using the Customer Analytics tab, you can understand who your customers are and how they shop:
- View sales data by country and city
- Analyze sales by time of day and day of the week
- Spot high-traffic locations for improved shipping strategies
- Time campaigns more effectively by identifying peak periods

✅ All insights are available from a mobile-friendly interface of the M2E Analytics app. Whether you’re in the office or on the go, you can quickly check key performance indicators and stay updated on the health of your business.
Frequently Asked Questions #
M2E Analytics #
How often is the data updated?
Sales data is updated daily, primarily based on order information. The M2E Analytics app needs some time to process the data, so insights typically become available starting from the previous day and earlier. Data for the current day will appear once it has been fully collected and processed.
Can I compare sales performance over different periods?
Yes, M2E Analytics lets you filter and compare data across custom timeframes. You can review sales trends, order volumes, and other key metrics by selecting specific dates. This helps you track growth, spot seasonal changes, and make informed decisions. Just choose the periods you want to compare at the top of the app’s page.
How do I access the M2E Analytics app?
Go to analytics.m2e.cloud and log in using your M2E Accounts credentials. You can also open the Analytics app directly from M2E Multichannel Connect by clicking the Apps icon (grid of boxes) next to your user profile in the top-right corner.
How do I import product costs into M2E Analytics?
To calculate profitability and unlock key financial metrics, you can import product costs into M2E Analytics from any source you use to manage them – Shopify, Magento, or others. Here’s how:
- Export your product costs from your system. Make sure the file includes two columns: sku and cost.
- Log in to your M2E Analytics account and go to the Profit Analytics tab.
- Click the Import Cost button and upload your file using the instructions provided in the pop-up window.


